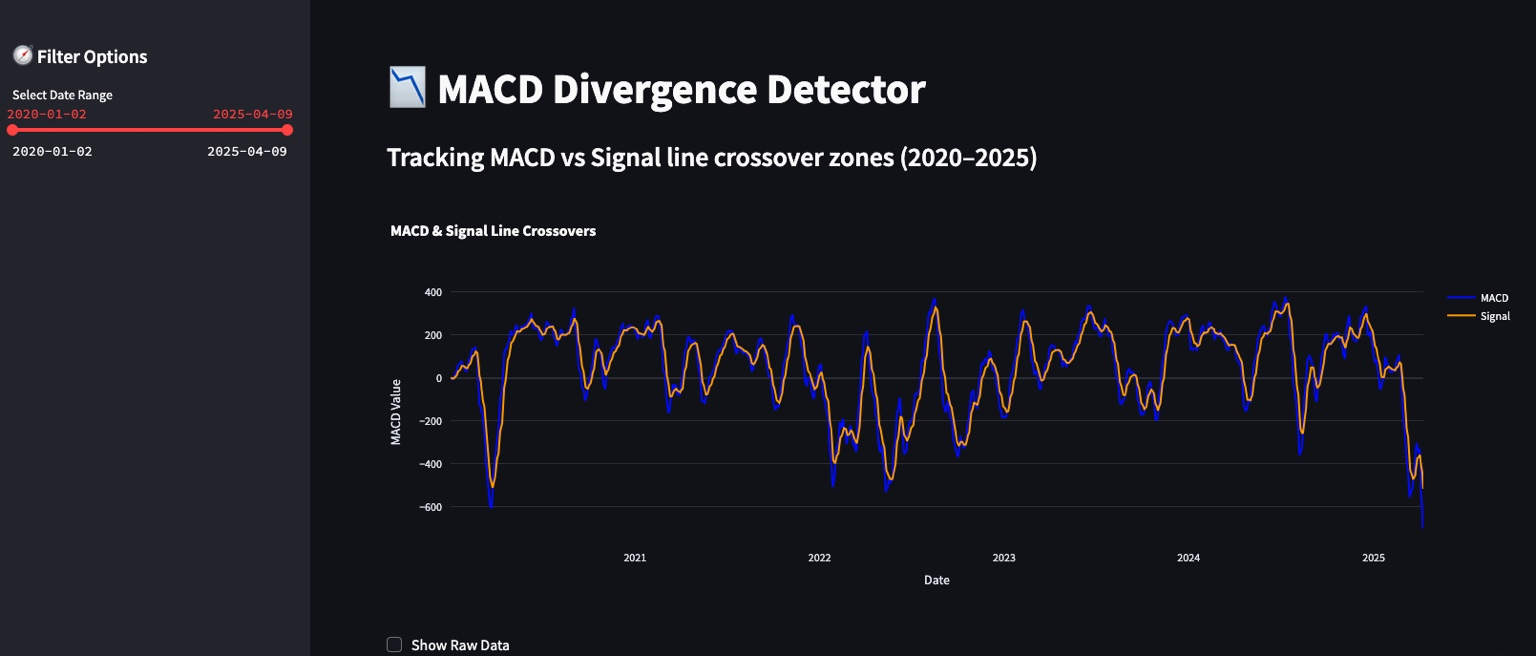
MACD Divergence Detector
Track MACD vs Signal line crossovers to detect bullish and bearish momentum shifts.
View Live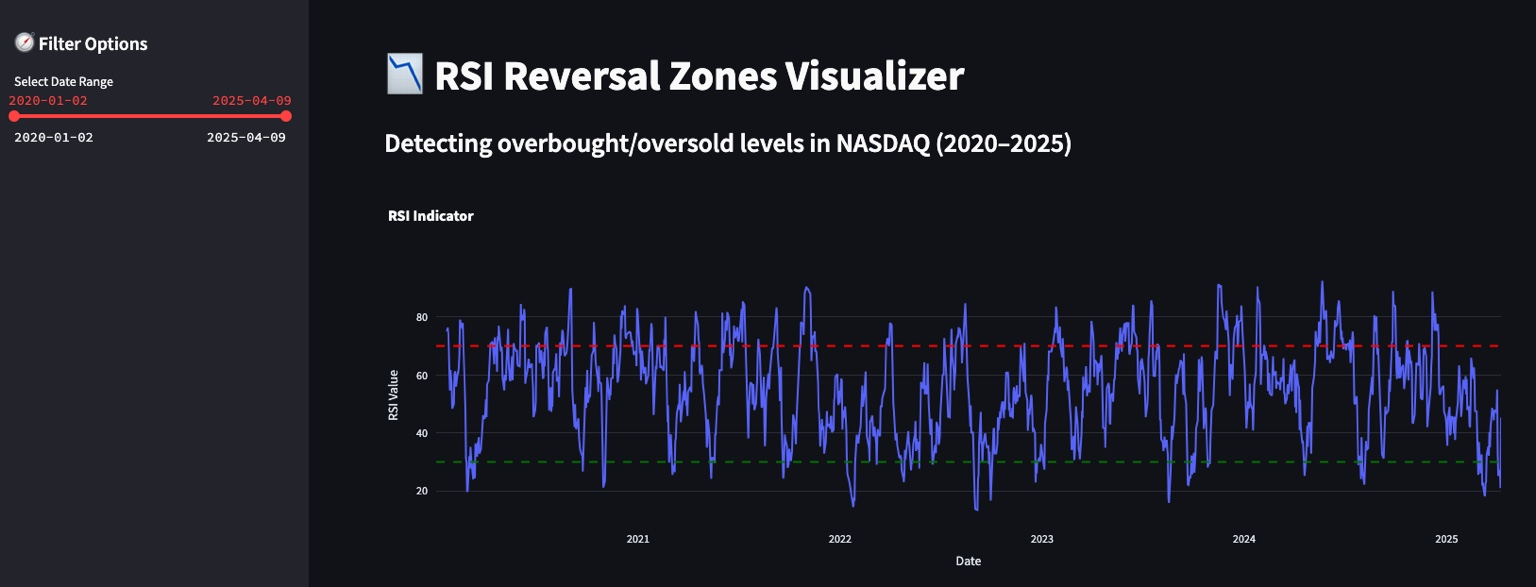
RSI Reversal Zones
Identify overbought and oversold levels to spot potential reversals in market trends.
View Live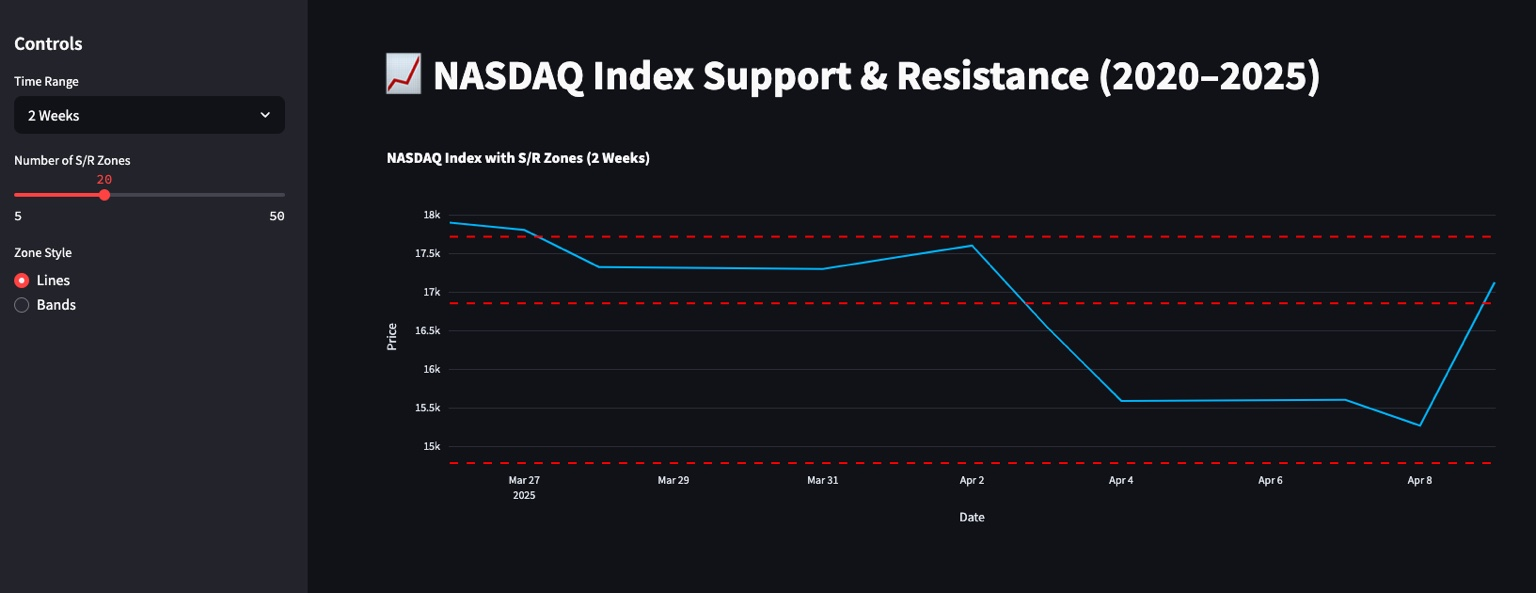
Support & Resistance Zones
Analyze price behavior across weekly/monthly zones to map S/R bands dynamically.
View Live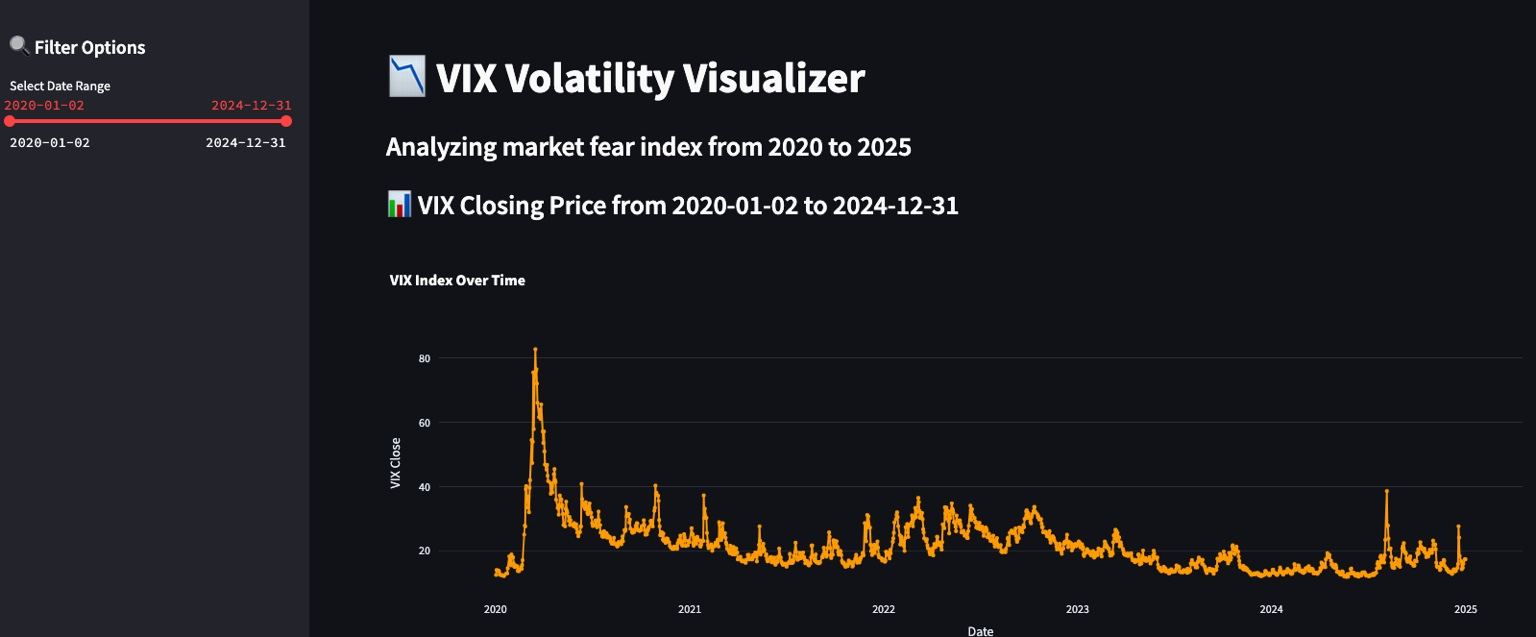
VIX Volatility Visualizer
Study the fear index (VIX) over time to understand market volatility and investor sentiment.
View Live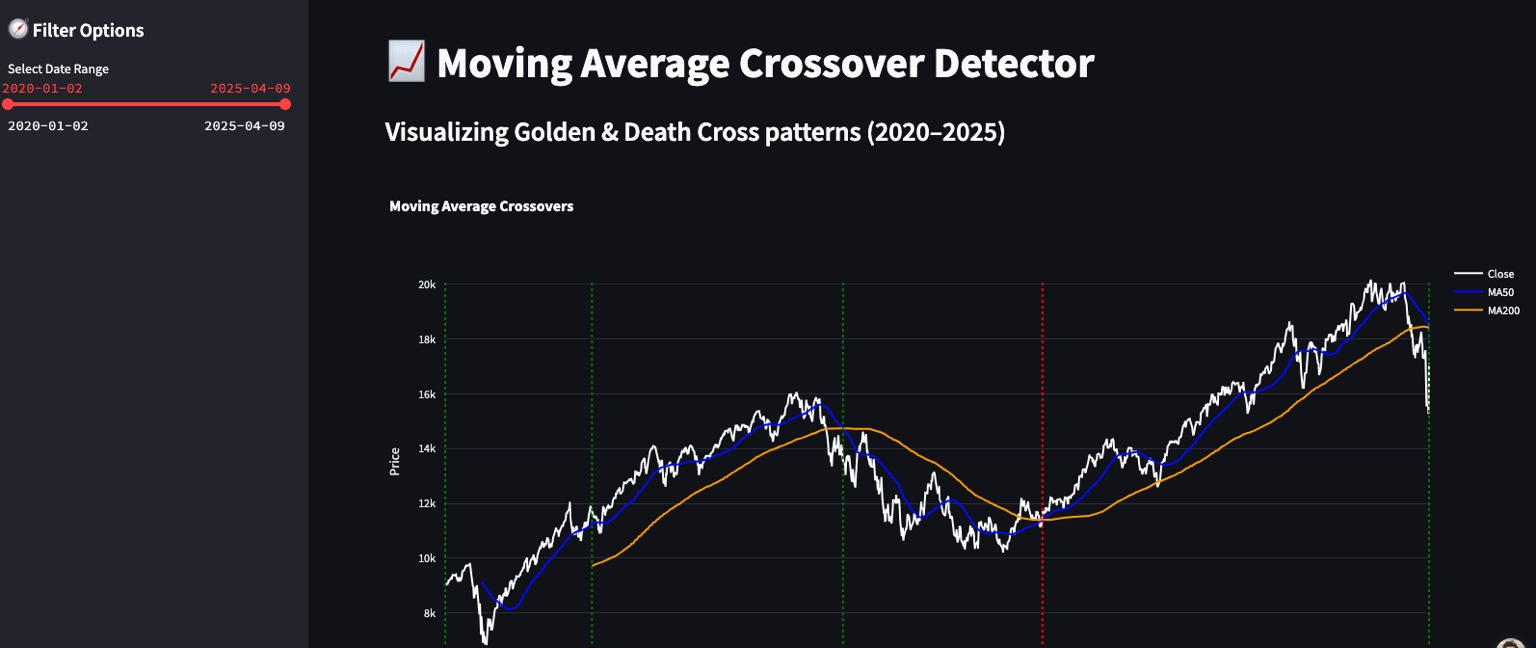
Moving Average Crossover
Visualize golden cross and death cross patterns to detect long-term trend shifts.
View Live